
What is process visualization?
Process visualization is the graphical or audiovisual representation of workflows in an organization, with the goal of making them understandable, analyzable and improvable. It covers formal modeling languages such as BPMN 2.0 (ISO/IEC 19510:2013) and Event-Driven Process Chains (EPC), simpler formats such as flowcharts and swimlanes, Lean methods such as value stream mapping and Makigami, and increasingly video-based execution guides. The right method depends on the goal: automation, analysis, communication or ramp-up at the workplace.
Why process visualization matters more in 2026
Companies have been documenting processes for decades. Even so, research at the Fraunhofer Institute for Industrial Engineering (IAO) on process mining and process modeling repeatedly finds that classical documentations remain incomplete and fail to answer the questions that matter: how do processes actually run, where are best practices, which deviations from the organizational specification exist?
The consequence is duplicated effort. The modeled process lives as a target specification in a tool, the actual reality lives beside it. Process visualization in 2026 therefore has to do more than a static diagram. It must close the gap between model and execution, be available in multiple languages, and integrate with the tools where work actually happens.
The good news: the methods for this exist. The right question is not which method is best but which method fits which goal.
Glossary: the eight core process visualization methods
The following definitions cover the methods you will encounter in European enterprises in 2026.
BPMN 2.0 (Business Process Model and Notation)
Global standard, released by the OMG in 2011 and internationally standardized as ISO/IEC 19510:2013. BPMN 2.0 distinguishes activities, events, gateways and pools/lanes. Frequently used as the basis for process automation because BPMN diagrams can be translated directly into workflow engines.
Event-Driven Process Chain (EPC, eEPC)
Developed in Germany (Universität des Saarlandes, Prof. Scheer) and historically dominant in the SAP and ARIS context. Alternates between events and functions, connected by logical operators. Being replaced by BPMN 2.0 in many organizations but still relevant in the installed base.
Flowchart
The classic format, common in ISO 9001 quality manuals. Simple boxes for activities, diamonds for decisions. No formal standard, no direct automation path. Increasingly replaced by BPMN 2.0 diagrams.
Swimlane diagram and process map
Extension of the flowchart with horizontal or vertical lanes per role or department. Makes responsibilities visible and is therefore popular for cross-departmental processes. Limit: with more than five roles the layout becomes hard to read.
Value stream mapping (VSM)
From Lean management (Toyota Production System). Separates value-adding and non-value-adding time, marks inventory, waiting times and information flows. Classic tool in manufacturing for identifying waste (muda).
Makigami
Japanese for “paper roll”. The process is visualized on a long paper roll with rows (roles) and columns (steps), including information carriers, times and a value-adding vs non-value-adding classification. Particularly established in administrative processes where value stream mapping is too coarse.
SIPOC
Suppliers, Inputs, Process, Outputs, Customers. High-level view that defines the boundary of a process. Popular in Six Sigma and kickoff workshops. Contains no detailed steps, just frames the scope.
Video process visualization
Recording of the actual execution, enriched with AI-driven segmentation into steps, subtitles and translations. Does not replace formal modeling. It complements it: BPMN shows what and when, the video shows how. Particularly strong for ramp-up, training and multilingual workforces.
Methods compared at a glance
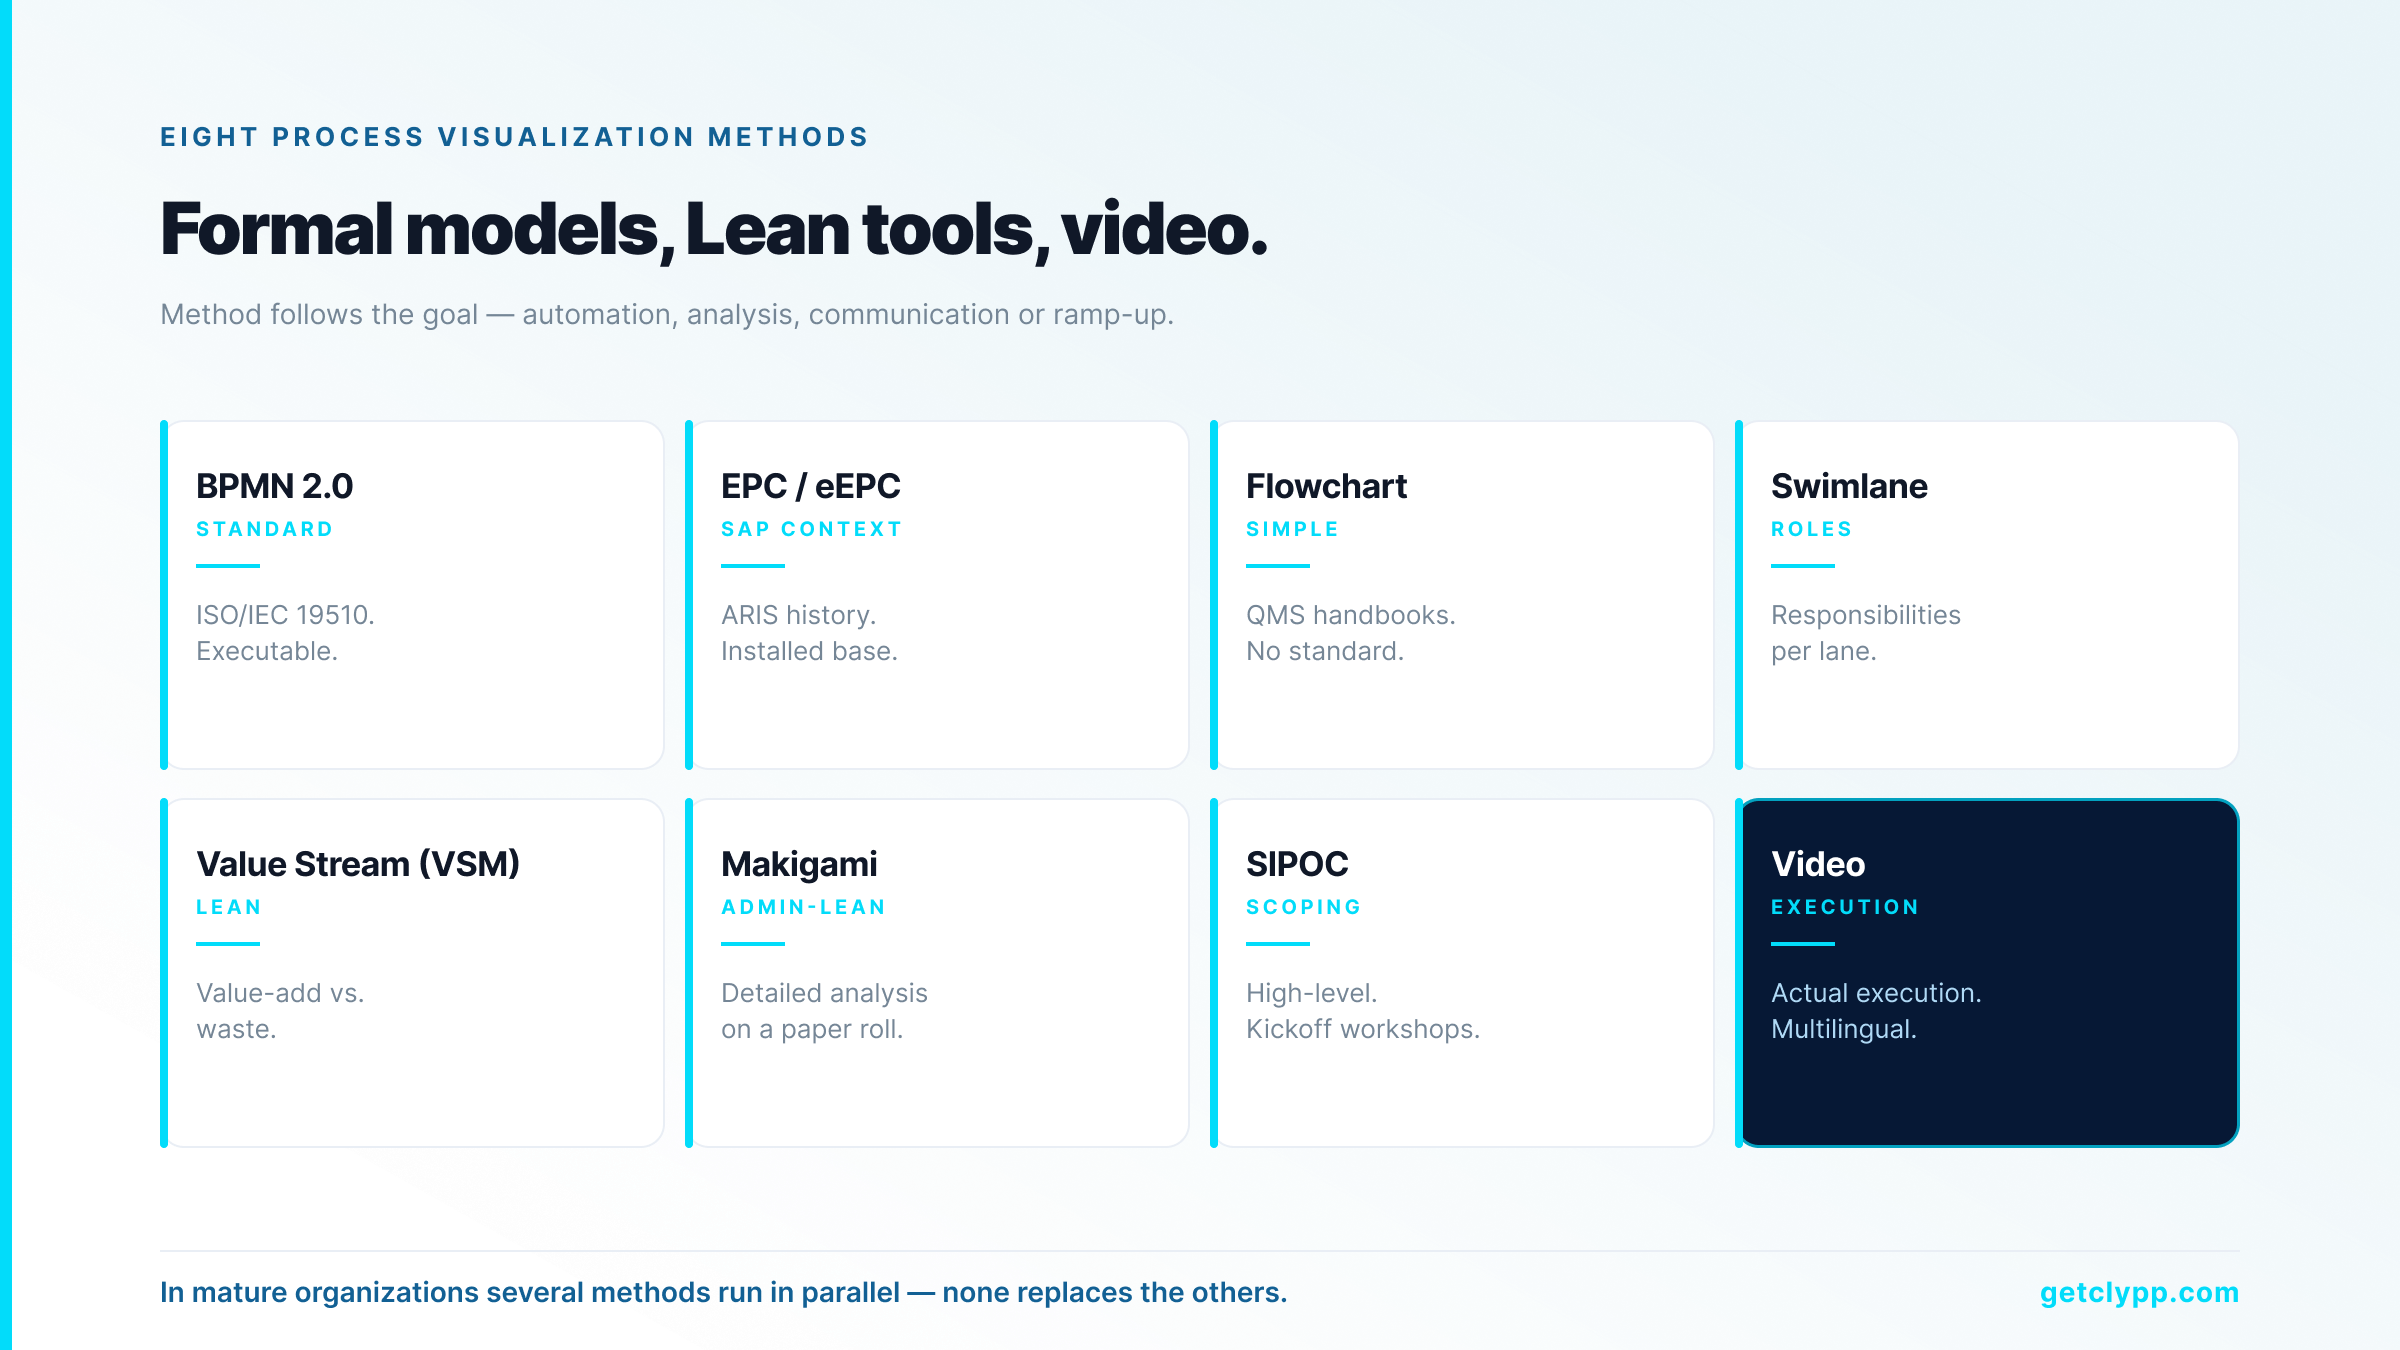
| Method | Strength | Weakness | Best fit |
|---|---|---|---|
| BPMN 2.0 | Global standard (ISO/IEC 19510:2013), executable | Steep learning curve, many notation elements | Cross-functional processes, automation base |
| EPC (eEPC) | Established in German SAP/ERP context | Increasingly replaced by BPMN 2.0 | ARIS-based landscapes, SAP processes |
| Flowchart | Simple to read, no prior knowledge required | No roles, no data flows | QMS handbooks, simple procedures |
| Swimlane / process map | Shows responsibilities per role | Cluttered with more than 5 roles | Cross-departmental processes |
| Value stream mapping (VSM) | Separates value-adding and non-value-adding time | Static snapshot, no IT support | Lean analysis in manufacturing |
| Makigami | Captures data and facts per step | Paper format, hard to maintain digitally | Detailed analysis of admin processes |
| SIPOC | Fast overview: Suppliers, Inputs, Process, Outputs, Customers | High-level only, no detail | Kickoff workshops, process scoping |
| Video process visualization | Shows actual execution, multilingual | Does not replace formal modeling | Execution level, ramp-up, training |
Which method when? A pragmatic decision path
The wrong question is “which method is best?”. The right question is “what do I need the visualization for?”.
• You want to automate the process (workflow engine, Camunda, Signavio, IBM BPM)? BPMN 2.0 is the given answer because the model is translated directly into executable code.
• You are in an SAP-driven organization with an ARIS history? EPC remains relevant for the installed base, new projects are increasingly done in BPMN 2.0.
• You describe processes for ISO 9001 or ISO 13485 audits and need documented information under §7.5? A flowchart or swimlane is formally sufficient but should carry version, author and date.
• You want to identify Lean waste in manufacturing? Value stream mapping in manufacturing, Makigami in admin processes.
• You are starting a process redesign and want to scope quickly? SIPOC in the kickoff workshop, then dig deeper.
• You want to train employees at the workplace or onboard new hires? Video process visualization, because it shows the actual execution and works in multiple languages.
In most mature organizations several methods run in parallel. BPMN 2.0 at the process level, swimlanes in the quality handbook, value stream mapping for optimization projects, video instructions at the workplace.
The role of video-based process visualization
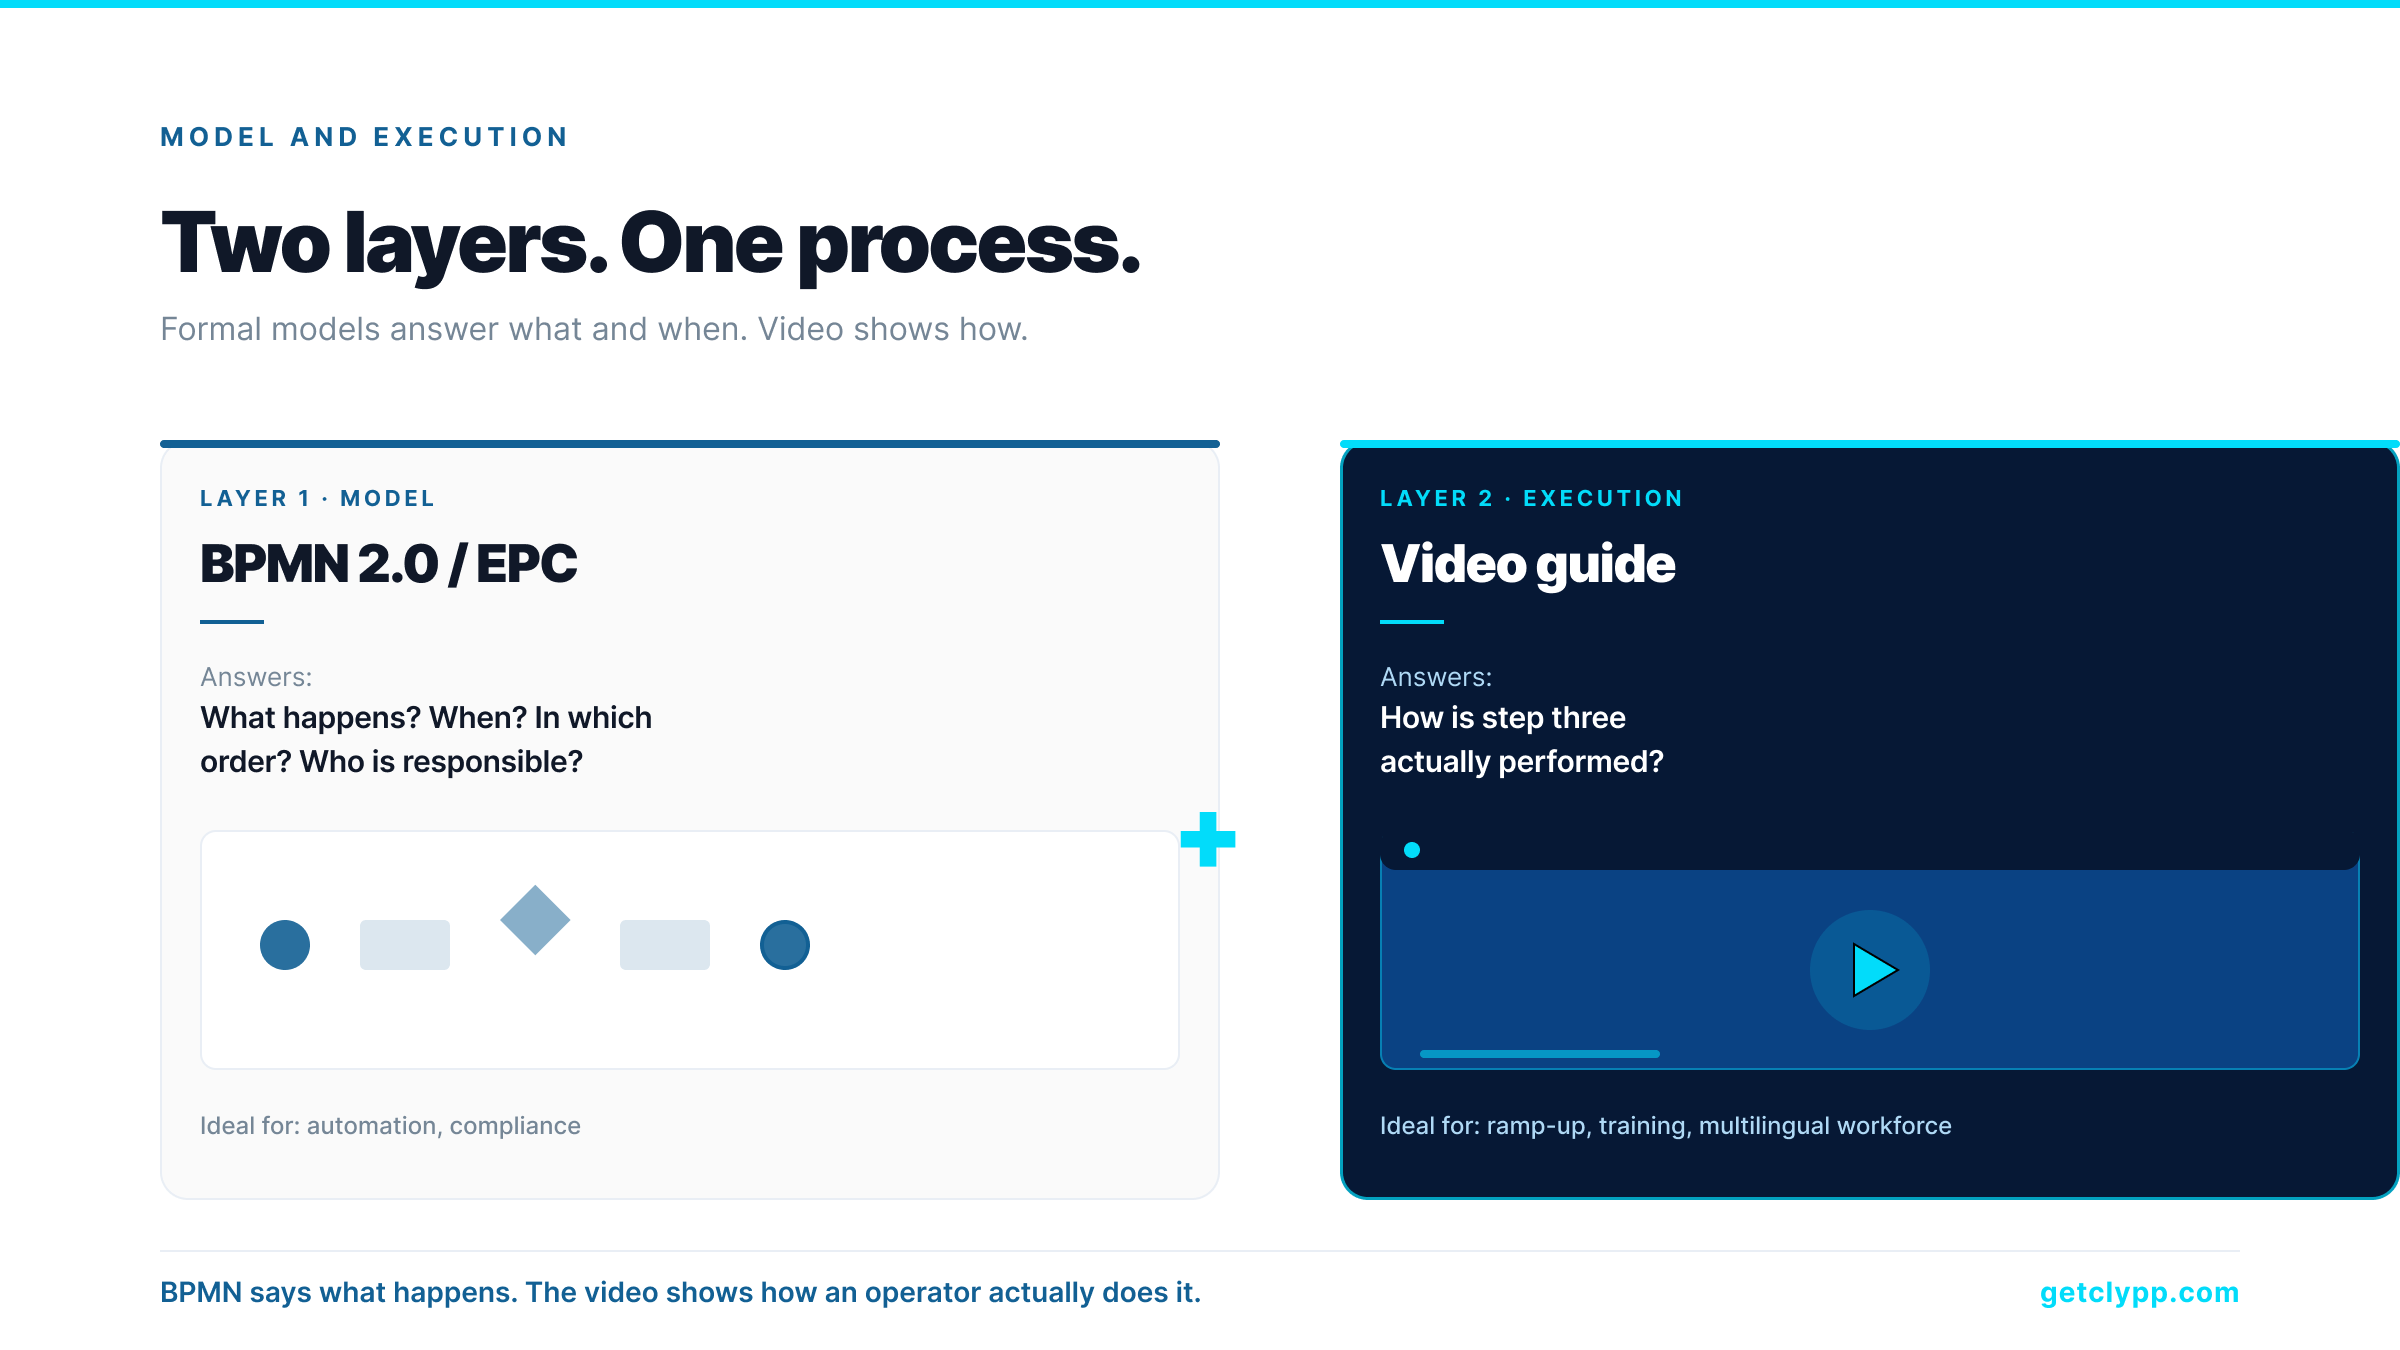
Formal models like BPMN and EPC are essential when processes are automated, audited or coordinated cross-functionally. They answer what happens, when and in which order. They do not answer the question: how does an operator actually perform step three?
This is where video process visualization comes in. It complements the formal model with an execution layer: concrete actions, screen interactions, tool operation, language. The classical model remains the target specification, the video becomes the ramp-up and training basis. Two layers, one process, no conflict.
Concretely: a BPMN diagram with ten activities can carry ten short video clips as attachments, linked at the corresponding step. The process owner keeps the formal overview, the operator gets the detailed step.
Where Clypp fits
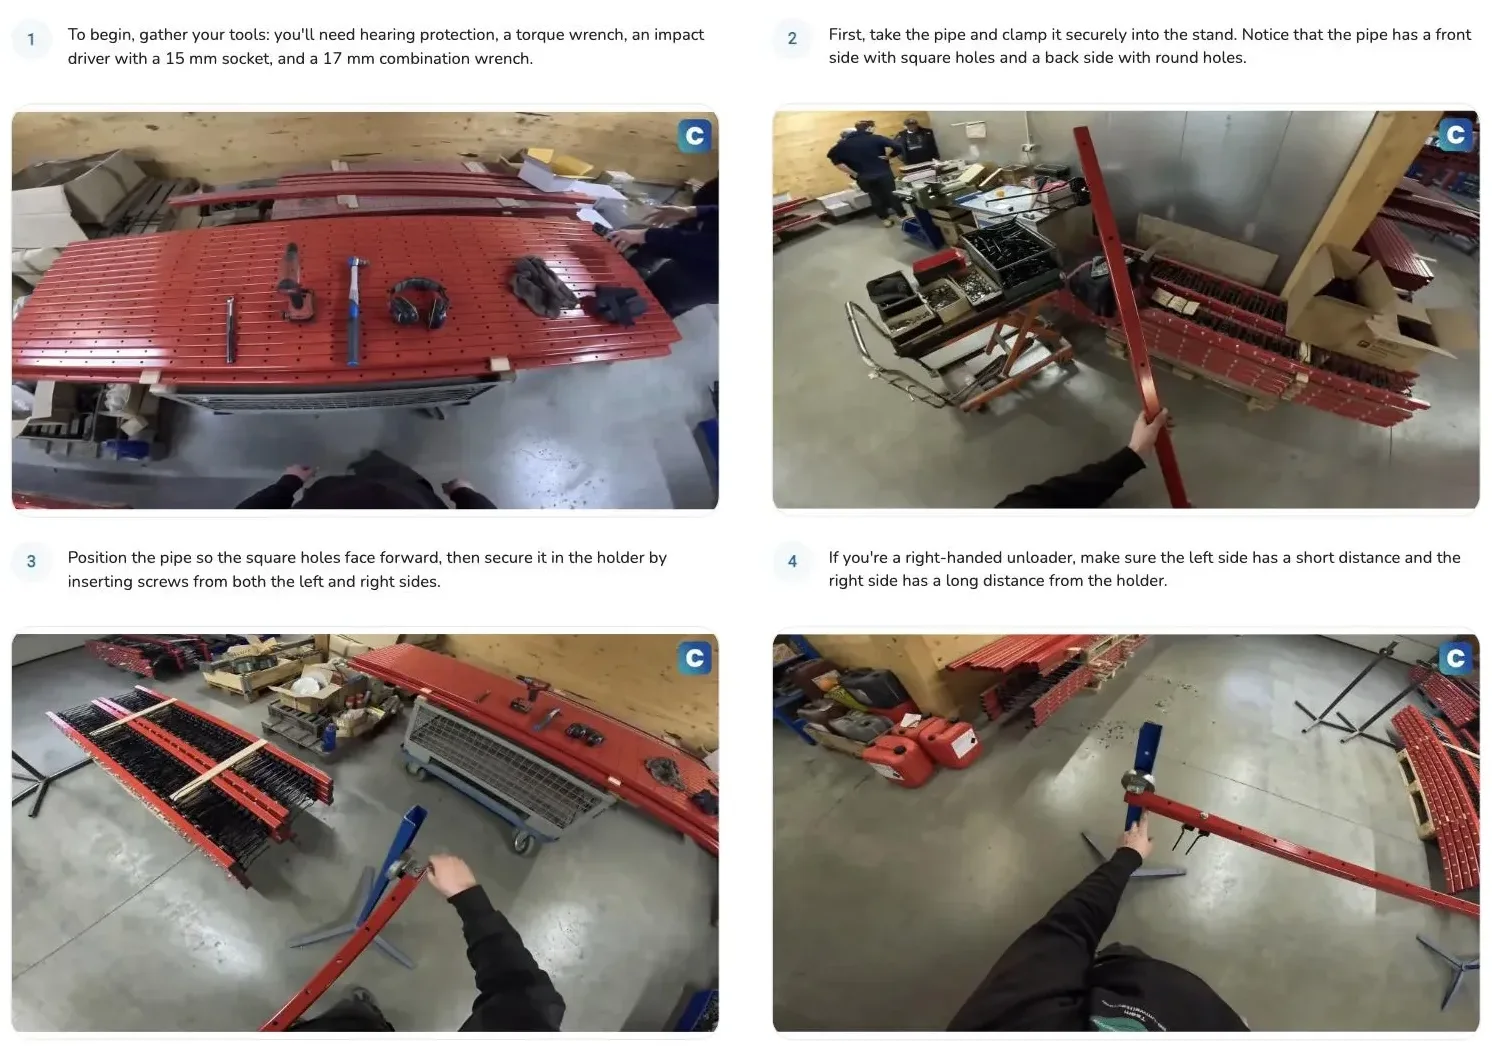
Clypp is an AI-powered video process documentation platform by Zesavi GmbH in Munich. Clypp does not replace BPMN modeling or an ARIS landscape. Clypp provides the execution layer: a recorded task becomes a structured, multilingual step-by-step guide with screenshots and voice-over, deployable directly at the workplace or in MS Teams.
Relevant for process owners in ISO 9001 or GoBD-driven environments: Clypp exports audit-conform process documents with version, author and timestamp metadata, directly usable as documented information under ISO 9001:2015 §7.5 and as part of a GoBD procedural documentation package. Native integrations with Microsoft Teams, Atlassian Trello, Jira and SAP, plus QR codes for shop-floor tablets. Infrastructure is ISO 27001-certified, EU-hosted and GDPR-aligned. Customers include Elementar Analysensysteme, Rosenberger Hochfrequenztechnik and Unternehmensgruppe Nassauische Heimstätte. A free workspace is available for small teams without a credit card; current plan details are at getclypp.com/pricing.
Common mistakes in process visualization
• One method for every purpose. BPMN is a poor fit for workplace ramp-up, a video is a poor fit for automation. Method follows goal.
• Too many notation elements on a single diagram. Ten activities per diagram is readable, thirty is not. Split into sub-processes.
• Diagrams without an owner and without a review cycle. A model without an owner goes stale unnoticed.
• No language plan for multilingual workforces. A German-language BPMN diagram for a workforce with five language groups only partially fulfills its communication role.
• Modeling done by the specialist department without the SME. The diagram is formally correct but rarely describes the actual workflow.
• No link between model and execution. A BPMN diagram in the tool and a paper work instruction at the workplace drift further apart with every process change.
A real-world example: BPMN plus video on a production line
An automotive supplier with around 400 employees has 25 core processes modeled in BPMN 2.0. The diagrams live in Signavio and are maintained by the quality department. At the shop-floor level the diagrams remain largely unused because they are too abstract to guide day-to-day work.
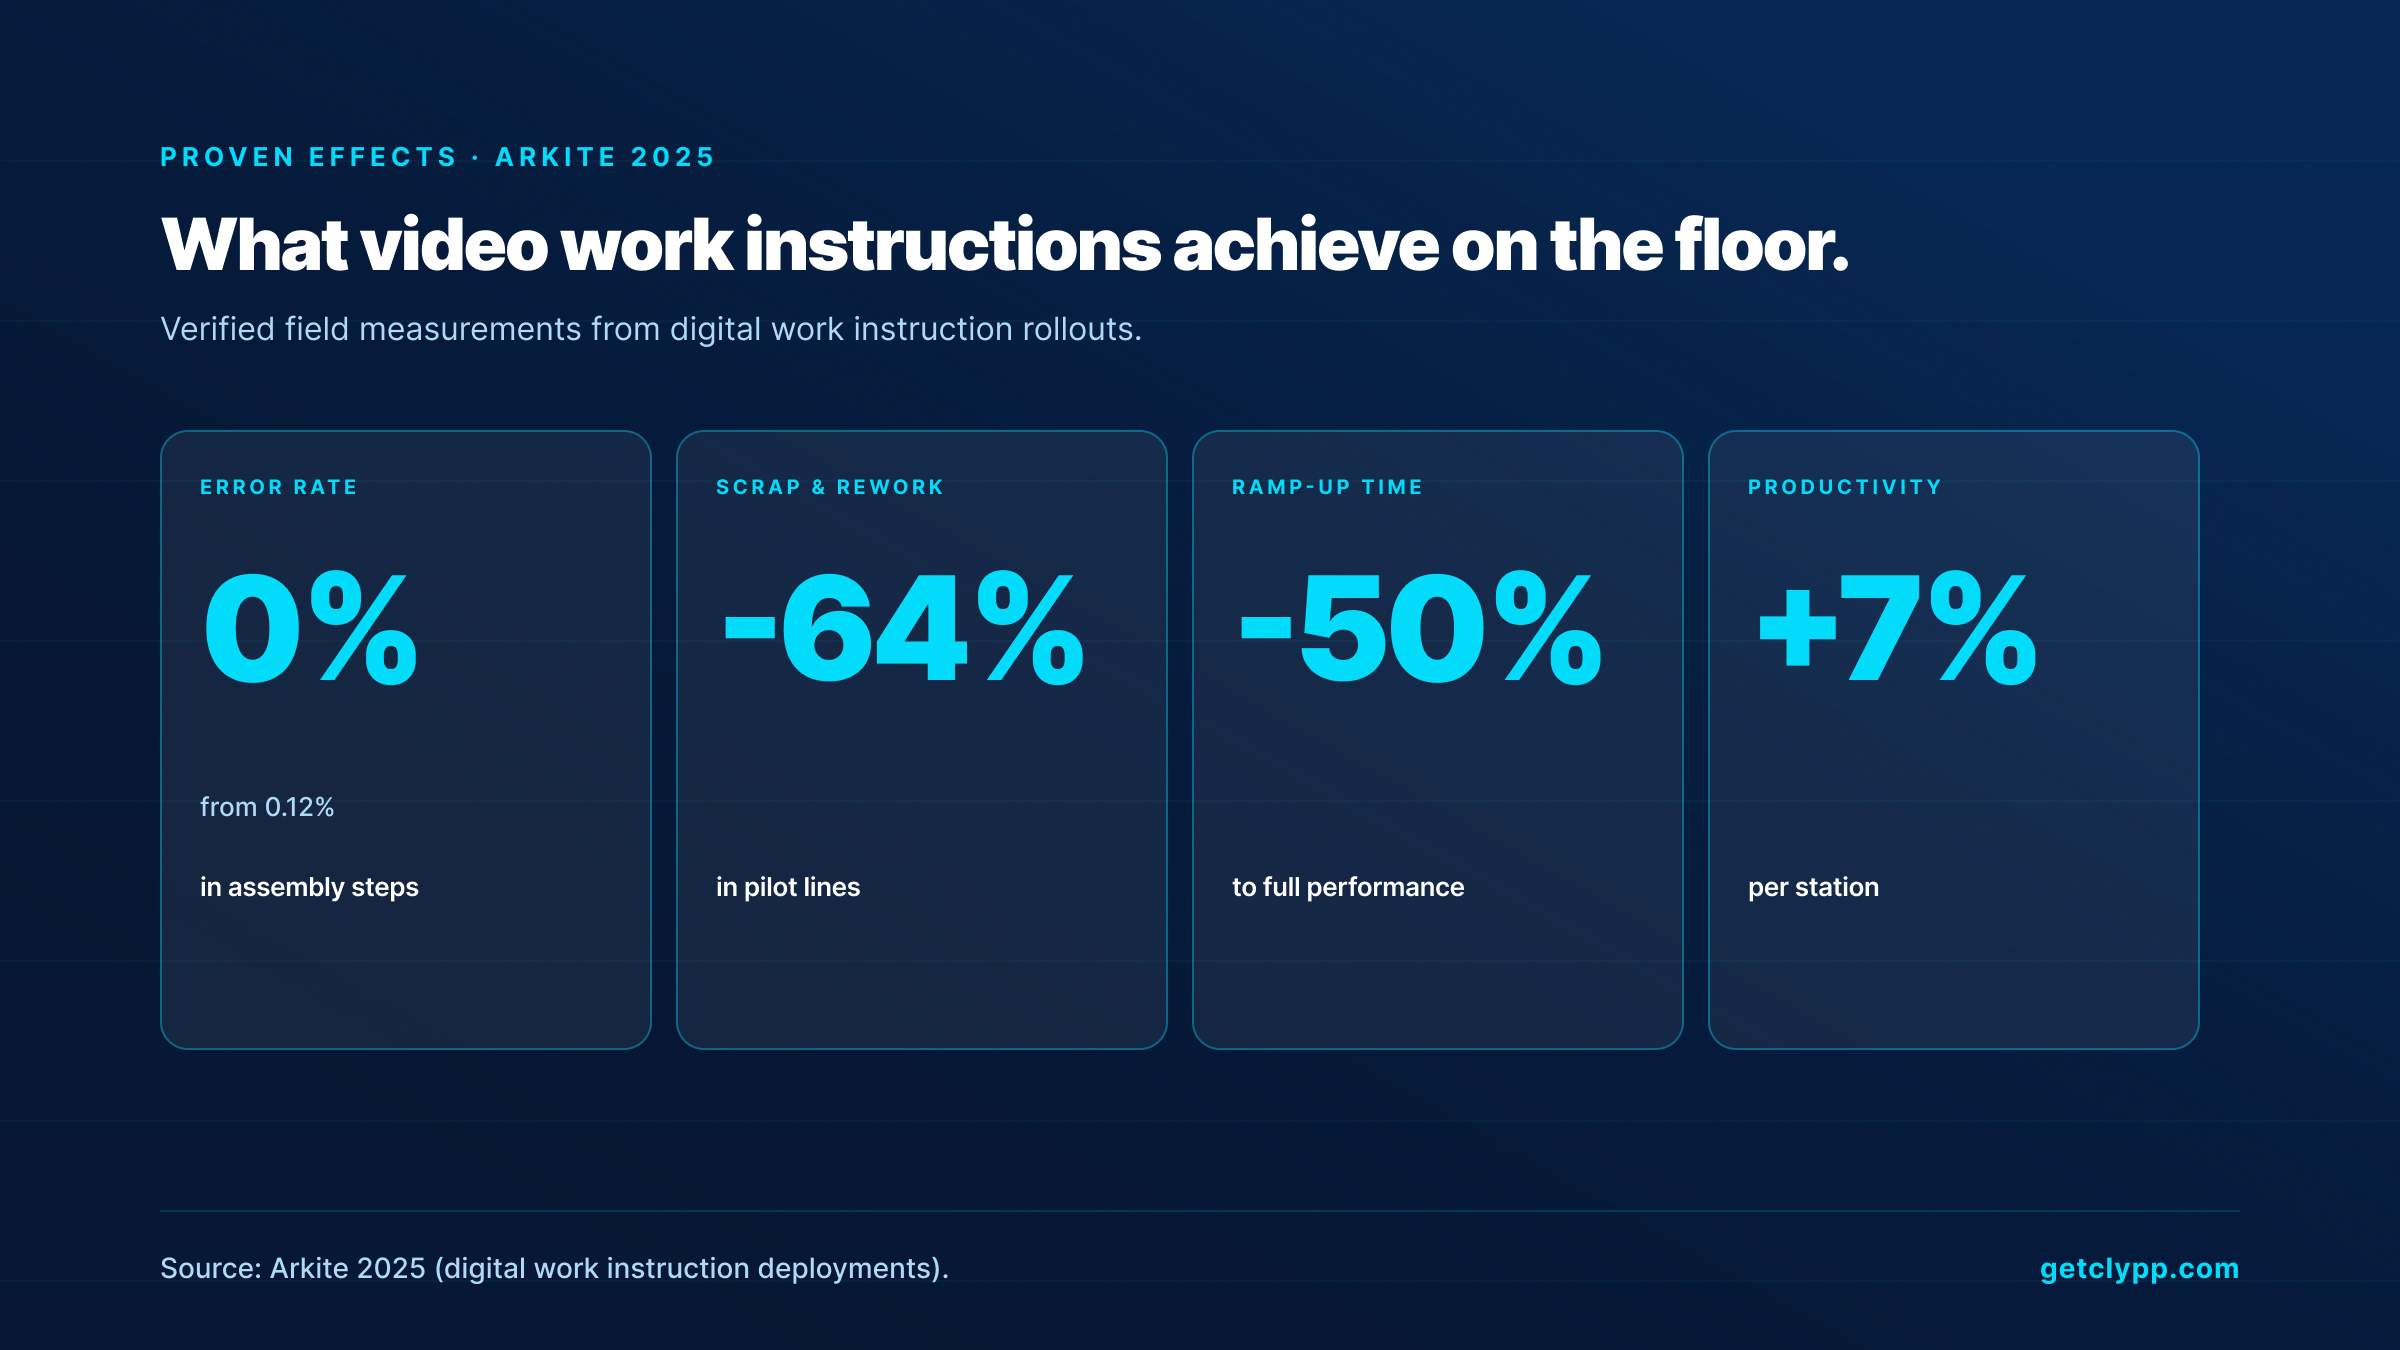
After adding Clypp videos to each activity the usage changes: operators open the relevant video by QR code at the machine, see the execution in their own language and finish with a short quiz. The BPMN models remain the target specification, the videos become the guide. Effects based on comparable industry cases (Arkite, 2025): error rate from 0.12% to 0%, 64% less scrap and rework, 50% shorter ramp-up time and 7% higher productivity per station.
How to build a process visualization stack in 90 days
• Days 1 to 15: build a process map at SIPOC level. Which 20 to 30 processes does your business actually have?
• Days 16 to 45: model the five most important processes in BPMN 2.0, with the specialist department and quality management.
• Days 46 to 60: for each activity in those five BPMN models, record a video (2 to 5 minutes) and structure it with Clypp.
• Days 61 to 75: roll out. QR codes at the workplaces, embedding in MS Teams, SCORM export for the LMS.
• Days 76 to 90: measure and iterate. View rates, completion rates, quiz results. Derive which processes are next in line.
Frequently asked questions
Does video process visualization replace BPMN?
No. BPMN 2.0 is the target specification for automation and cross-functional coordination. Video shows the actual execution and is the ramp-up and training basis. They complement each other, they do not compete.
Is EPC still relevant?
Yes, in the installed base. Companies with a maintained ARIS landscape will not migrate. New processes are increasingly modeled in BPMN 2.0, partly because BPMN is internationally standardized as ISO/IEC 19510 and more directly executable.
Which method is accepted for ISO 9001 audits?
Formally none in particular. ISO 9001:2015 §7.5 requires “documented information” with version, author and date, without prescribing a format. Flowcharts, swimlanes and BPMN are all acceptable, provided that version and approval control is demonstrable.
How much time does video-based visualization actually save?
In creation: a 5-minute task becomes a structured instruction with screenshots, voice-over and translations in 5 to 10 minutes. In maintenance: a process change leads to a new recording in minutes rather than a PDF revision in hours. In ramp-up: industry cases (Arkite 2025) report 50% shorter ramp-up time.
What role does process mining play?
Process mining reconstructs the actual flow from IT system logs. It is a third layer alongside model (BPMN) and execution (video). Fraunhofer IAO uses it to answer questions such as: where do processes deviate from the specification, where are the optimization potentials? For workplace ramp-up it is not the right tool, for process analysis it is extremely valuable.
Does Clypp fit into a heterogeneous process tool stack?
Yes. Clypp complements existing modeling tools like Signavio, ARIS or Camunda with an execution layer. Videos are embedded into BPMN models, wikis or the LMS by link, embed code or QR code. Native integrations for Microsoft Teams, Trello, Jira and SAP.
What does Clypp cost?
A free workspace is available for small teams without a credit card; paid tiers exist for larger deployments and enterprise pricing for organizations with custom requirements. Current details are at getclypp.com/pricing.
Bottom line
Process visualization in 2026 is not a question of the one right method but of an aligned stack. Formal models like BPMN 2.0 and EPC structure the process landscape and enable automation. Simpler formats like flowcharts and swimlanes serve communication and audit documentation. Lean methods like value stream mapping and Makigami find waste. Video-based visualization closes the final gap between model and actual execution, makes processes multilingual and available at the workplace.
BPMN shows the flow. Video shows the grip.
A diagram answers who hands over what, and when. It does not answer how tight the screw sits, or how you notice something is jamming. Both layers are needed, and the second one takes two minutes with Clypp instead of a workshop.
- Complements your modelling: diagram for structure, recording for execution.
- Recorded by the person performing the step: no modelling skills required.
- Output as video, PDF or SCORM: linkable straight from the process step.
Clypp is a software platform from Germany for video work instructions. In use at RATIONAL, Rosenberger and Elementar, among others.

